(Quarterly) reporting in one overview
At actions en strategies the owner can add progress reports.
The reporting dashboard provides an overview of these reports.
Set up reporting dashboard
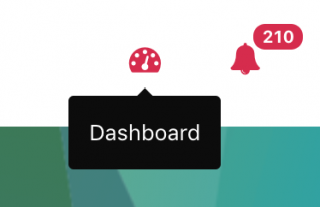
- Click on the Dashboard icon in the top right of the screen
- Click on 'Reporting dashboard' in the menu on the left.
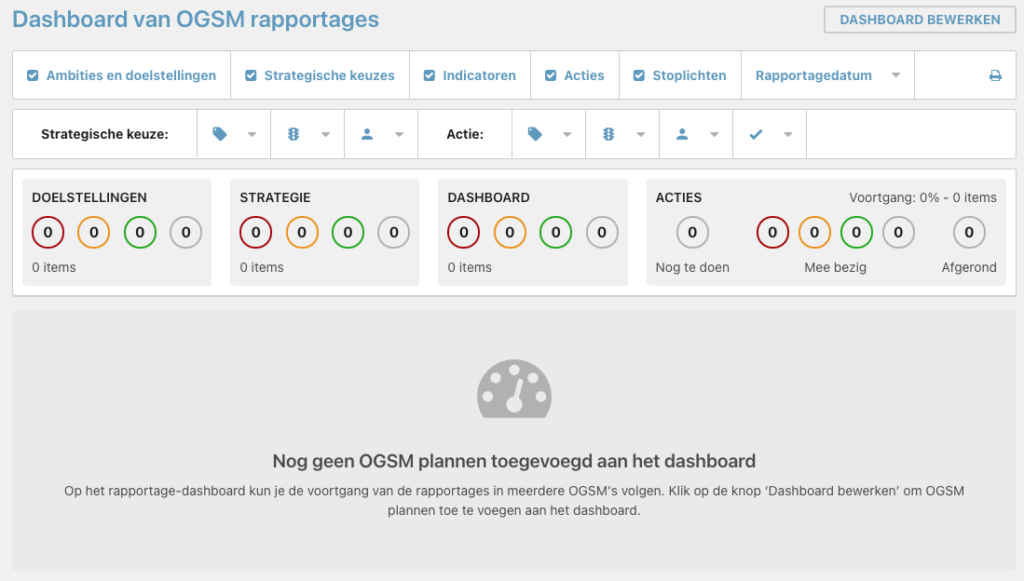
- You enter the dashboard. The dashboard is still empty, because you first have to set which OGSMs you want to see.
- Click the 'Edit dashboard' button at the top right.
- Click on the 'Add' button and select the OGSM you want to see.
- Also add other OGSMs to the dashboard.
- You can change the order of the OGSMs by dragging them. Use the three dots in front of the title of an OGSM for this.
- Click on 'Save' to save the changes.
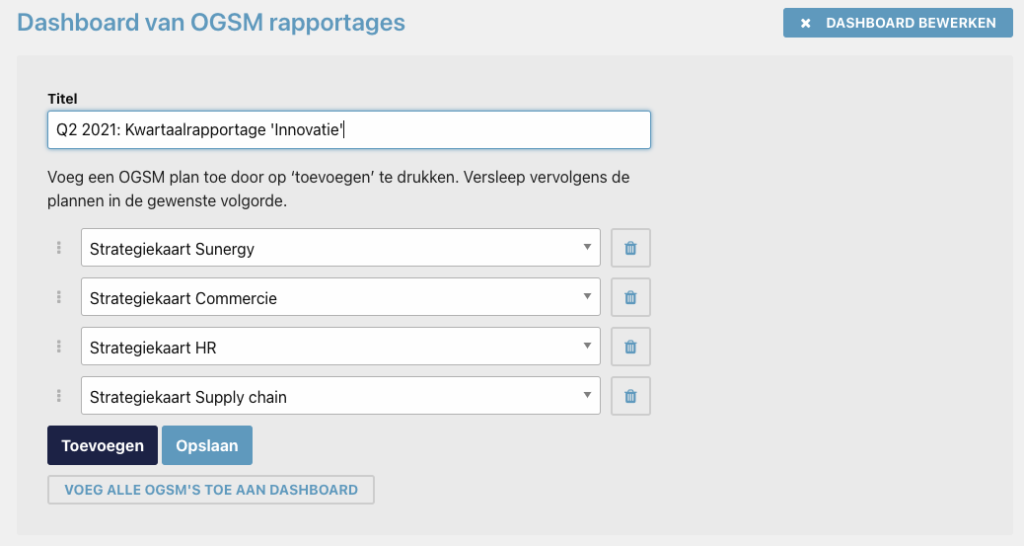
Add title above the report
A title makes it immediately clear which report it concerns. Especially if you share the report on paper or as a PDF. The title is visible above the report.
- Click on the 'Edit dashboard' button.
- Type the title.
- Click on 'Save' to save the changes.
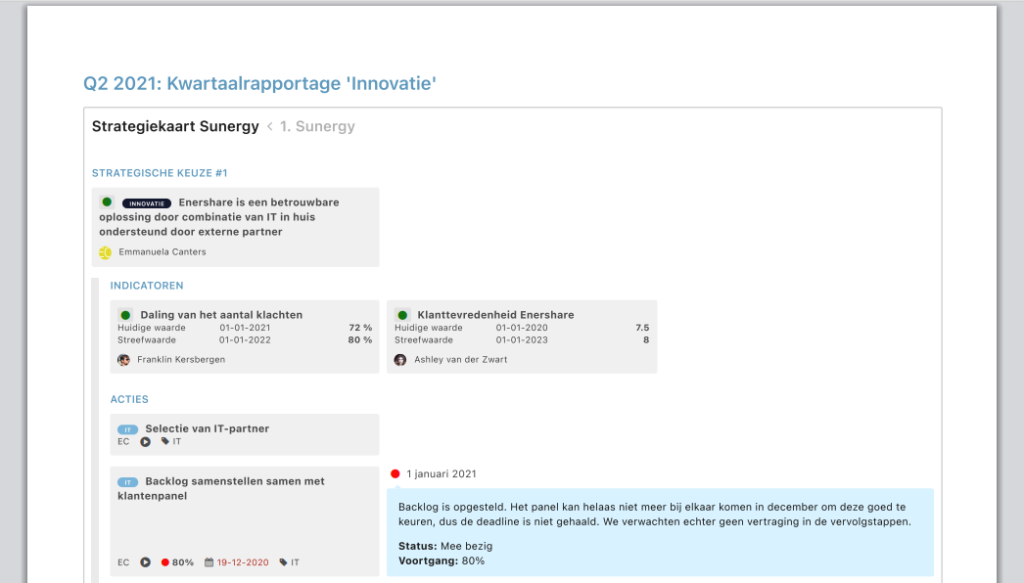
View reports
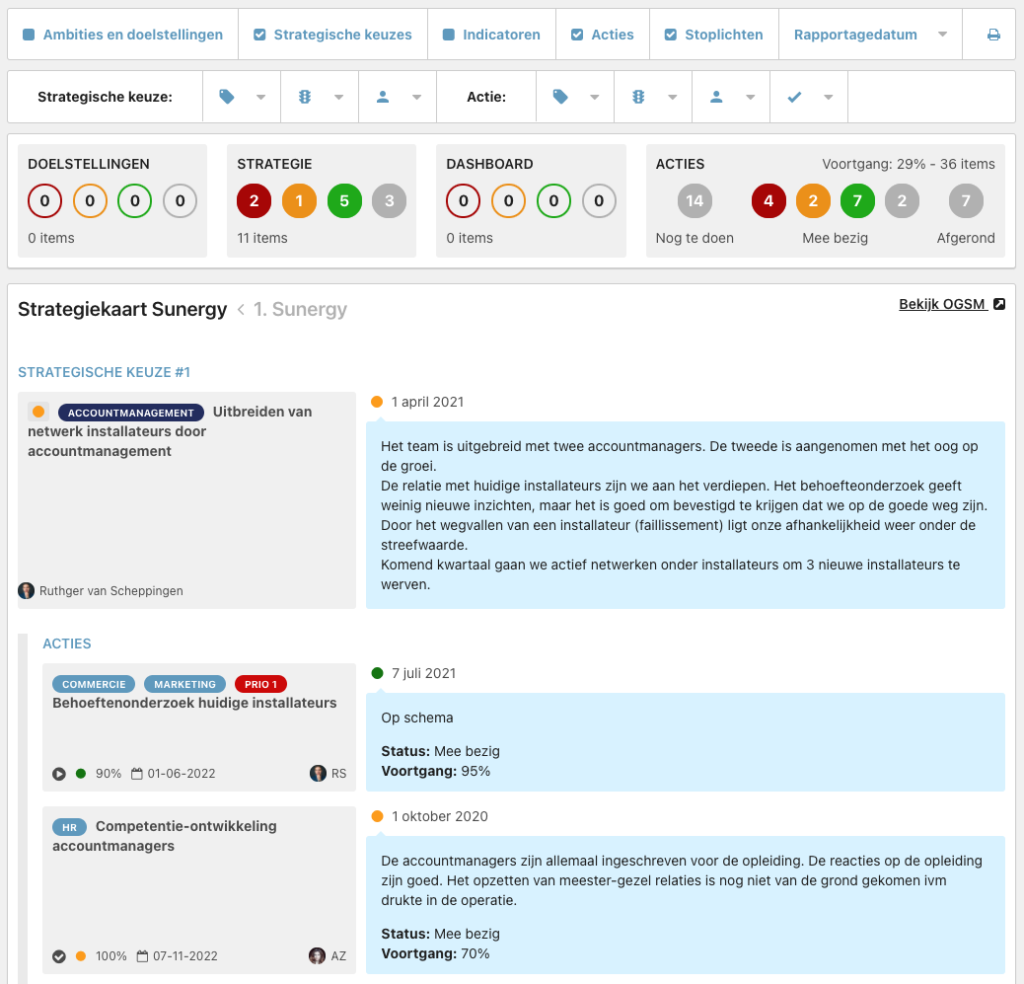
You will now see the reporting dashboard. At the top is an overview of the traffic lights. This provides insight into the number of items on red, orange or green. The overview is dynamic. If you set a filter, the numbers will change.
Below that are the OGSMs, with each OGSM having the following components:
- The link 'View OGSM' to go to the relevant OGSM
- The objective
- The goals
- The strategies, including the most recent report
- The indicators with the target value and the most recent measured value
- The actions, including the most recent report
Filter reporting
By default, the dashboard shows the full OGSMs. You can use the filters to make specific selections. For example:
- Use from the selected OGSMs to provide an overview of all actions labeled 'Marketing'.
- Only show the strategies that are on orange or red.
- From the selected OGSMs, show all indicators and actions that belong to a strategy with the label 'Commerce'.
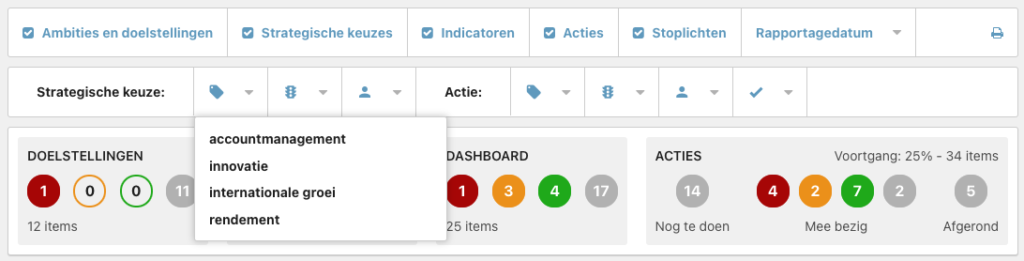
Turning components on and off
You decide which parts you want to see on the dashboard by removing the check marks or adding for:
- Ambitions and goals
- Strategies
- Indicators
- Actions
- traffic lights
Filter content from OGSMs
You can filter the displayed content with these filters:
- Strategic choices:
- Label strategy: The dashboard only shows the strategies with one of the selected labels. The indicators and actions are also shown with the strategies.
- Traffic light strategy: The dashboard only shows the strategies with one of the selected colors. The indicators and actions are also shown with the strategies.
- Owner strategy: The dashboard only shows the strategies of the selected owner.
- Actions:
- Label action: The dashboard only shows the actions with one of the selected labels.
- Traffic light action: The dashboard only shows the actions with one of the selected colors.
- Owner action: The dashboard only shows the actions of the selected owner.
- Status action: The dashboard only shows the actions with one of the selected statuses (To be done, In progress, Completed).
- Report date: The dashboard only shows the reports with a date after the set date. If after this date there are multiple reports for a strategy or action, they will all be shown.
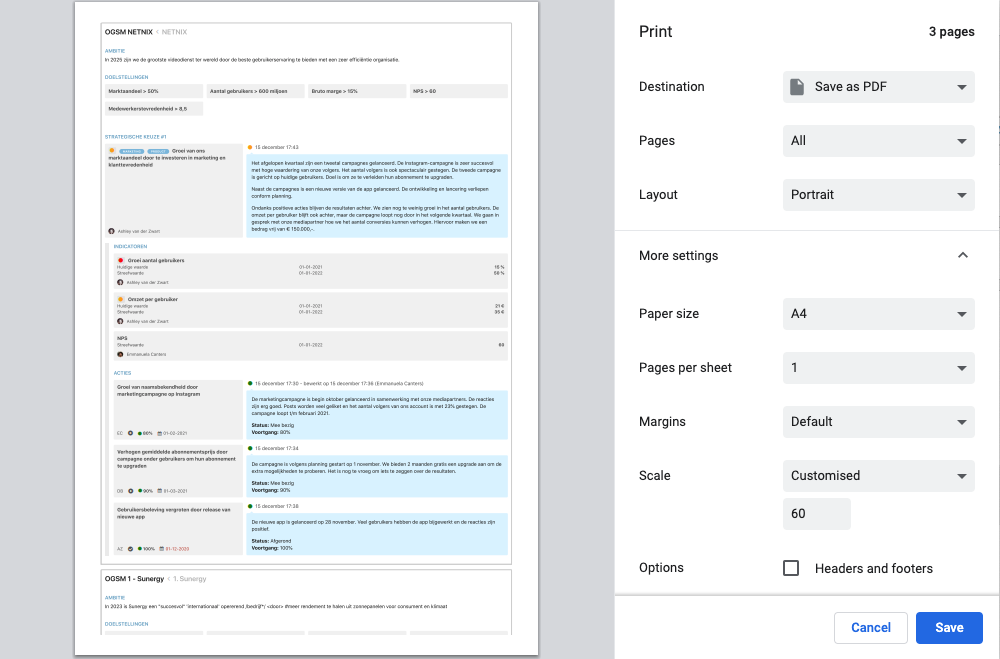
Print or download report as PDF
- Click on the print icon at the top right

The browser now displays a print screen. In most browsers you can choose here whether you want to print the file or download it as a PDF file.
- Select the printer or choose to save the report as a PDF.
- Use the browser settings to shrink or enlarge the text. By changing the scale, more text will fit on one page.