Benchmark
Overview of the results of your company
Insight into industry performance
Find out where you can improve
Get started with the Action Plan
Benchmark: start of improvement
As a trade association or franchise organization, you use the Benchmark to provide members with a powerful tool for continuous improvement. You also gain insight into the results of the industry yourself.
“Thanks to the benchmark, we have enormously valuable contact moments with our members. We can really make a difference there. With the benchmark we are taking a huge step forward to help our members even better in realizing their objectives. ”
Alwin Pol, NEVAT business coach
Benchmark for members
Direct insight into the performance of the organization
Specific indicators for the sector
Insight into historical performance
Compile your own dashboard
Draw up and monitor online improvement plan
User-friendly and attractive
Benchmark for trade associations
Insight into member performance
Concrete tools for members to improve themselves
Talk to members about achievements and actions
Easy to manage
Flexible to set up: easily add new questions and KPIs
Own logo, domain name and colors
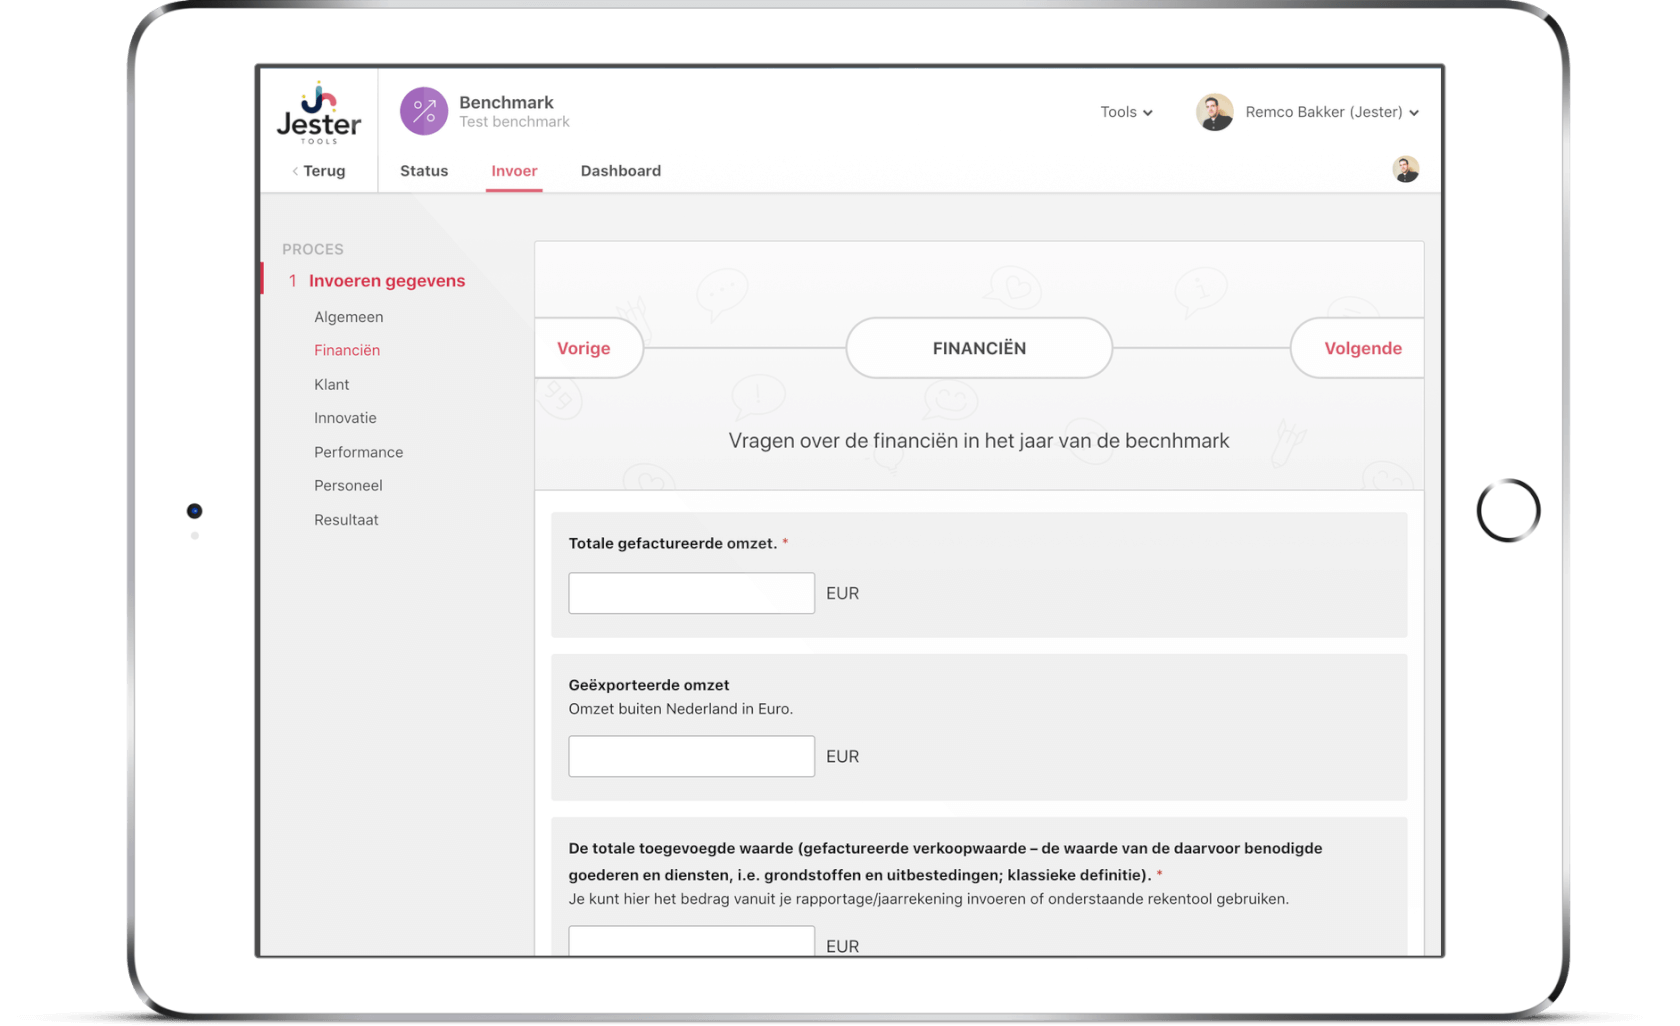
Entering data
The indicators on the dashboard are calculated from the entered data. Entering is simple and clear.
Enter data and have it checked
The entrepreneur enters the data using the clear form.
The form is divided into different categories.
The form is automatically saved during entry.
The entrepreneur can invite a controller or accountant to fill in the form together.
The benchmark administrator checks the submitted data to ensure the quality of the benchmark.
View the results of the benchmark
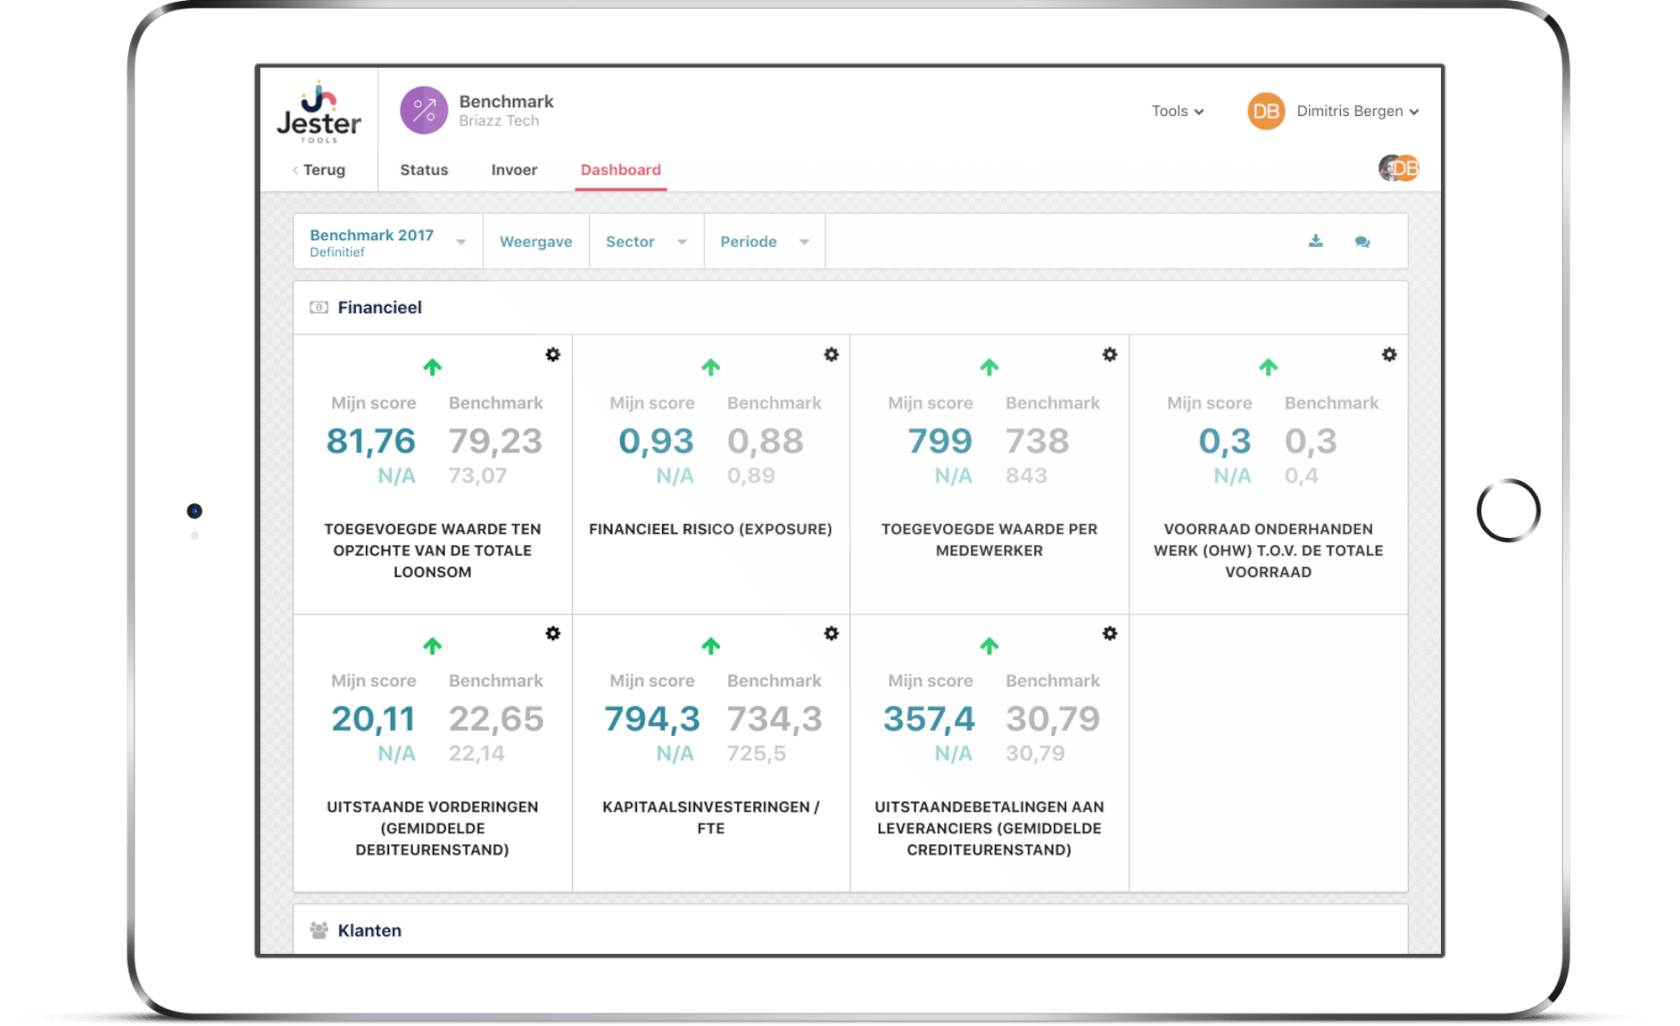
The dashboard is compiled in real time after entering the data. This is how the entrepreneur sees his results immediately.
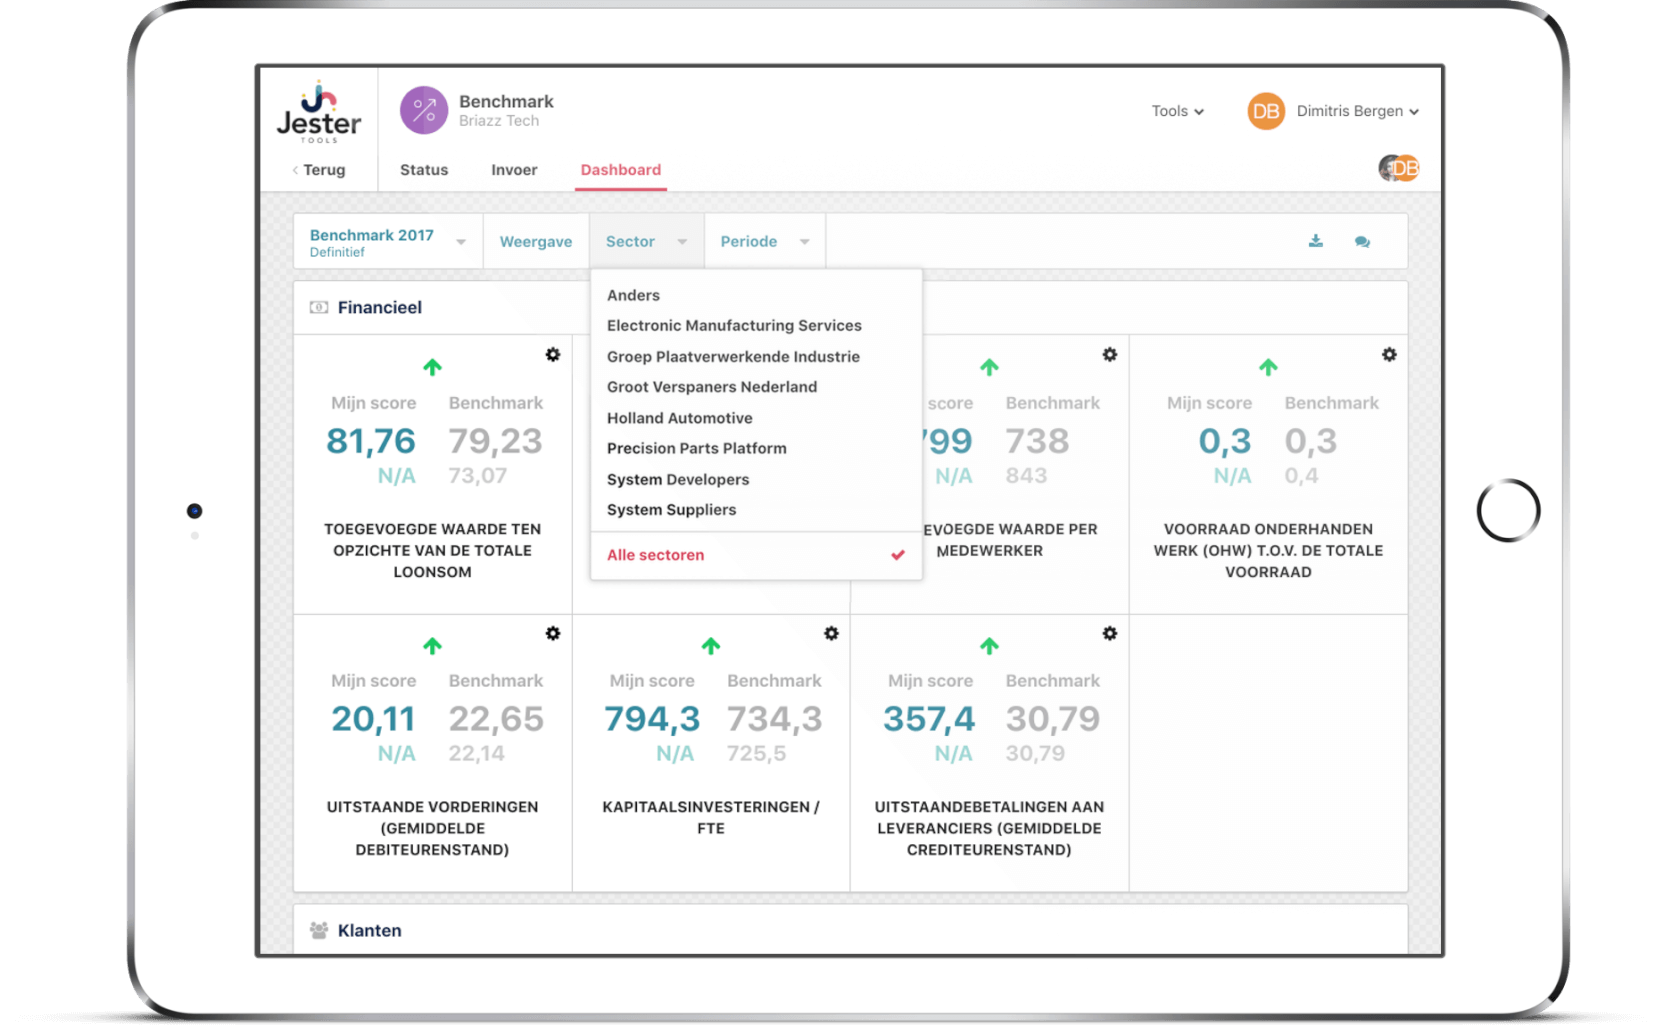
Dashboard with KPIs
The dashboard shows the results of the KPIs. These KPIs are calculated on the basis of the entered data. E.g. Turnover per employee. Percentage of quotations that lead to an assignment, etc.
The form and the KPIs are fully adjustable.
The entrepreneur can download his results in Excel and PDF format.
Filter and customize dashboard
The entrepreneur can filter his dashboard (eg by sector) and adjust it. He himself determines which KPIs are on his dashboard.
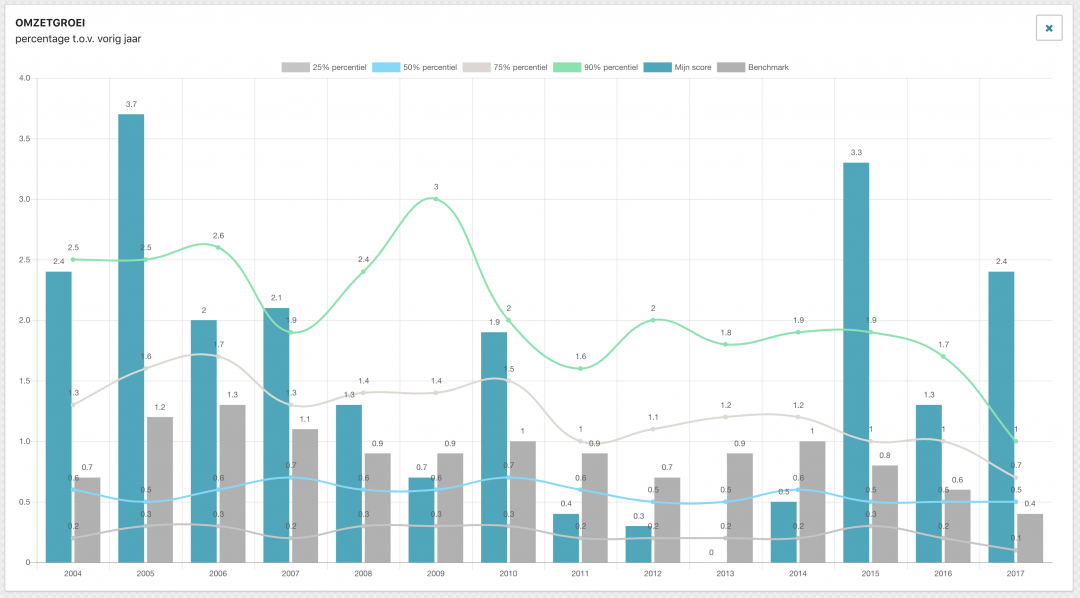
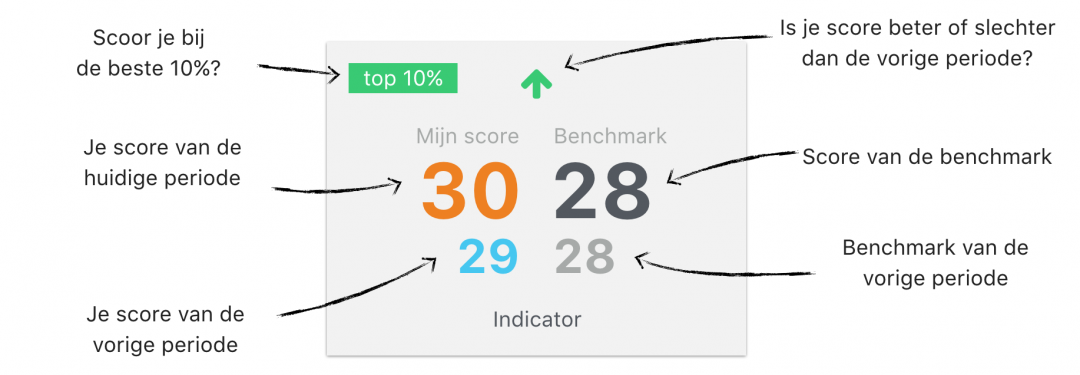
View history
There is a graph for each KPI that shows the history of your own score and the benchmark.
The percentiles are visible in the graph, so you can see which score you have to get to be among the top 50, 25 or 10%.
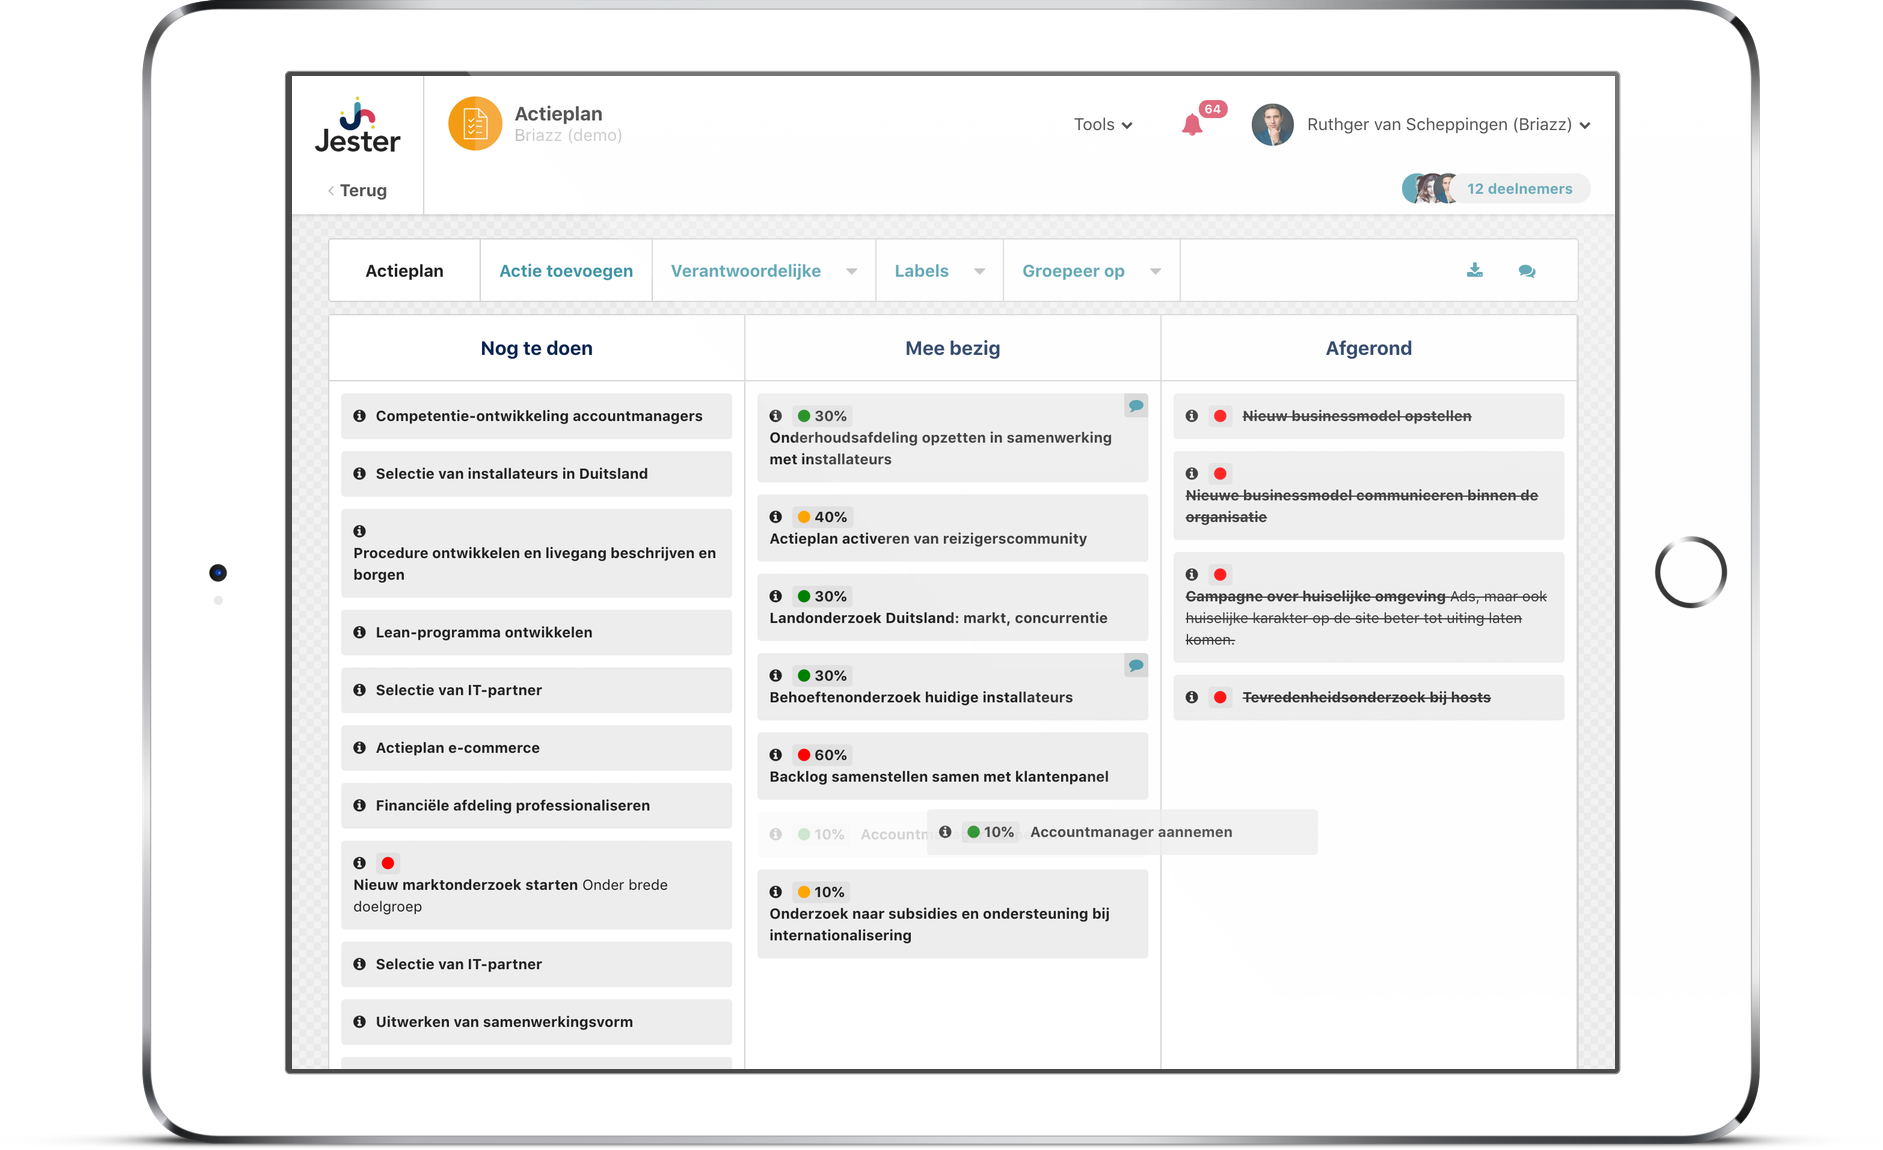
Get started with improvement
Part of the Benchmark is an online Action plan. In this plan, members record their actions and monitor progress. The Benchmark can also be expanded with the tool about it business model canvas or with it OGSM Plan to draw up a strategic plan.
We unburden
Then you can focus on the membersEase
We have clear instructions for administrators and users of the benchmark.
We train you to use the benchmark successfully.
We support you during use.
Create new users, post content, questions? Contact us and we'll take care of it.
Coaching of entrepreneurs
The Benchmark is only a success if it is used by entrepreneurs and it helps them to improve. Our experienced business coaches help entrepreneurs on their way by asking questions, holding up a mirror and giving concrete advice. We also provide practical master classes.
Security
Passwords are stored encrypted and cannot be retrieved by anyone
Encrypted connection (SSL certificate, 256-bit)
We program according to OWASP Top 10. These are the important security risks.
Our hosting is ISO 27001: 2013 and PCI-DSS v3 certified
We regularly have our tools tested with a penetration test
Protocols for testing and going live of updates
Request a demo
and see our tools in real life